
Application Logging is a very critical requirement in any enterprise application ecosystem. It helps assess threats, analyze errors, and ensure your business runs smoothly and efficiently. Logging involves the systematic recording of events, errors and activities within an application, creating a chronological trail that aids in troubleshooting and debugging. It serves as a valuable resource for developers to identify issues, understand the execution flow and diagnose unexpected behaviors. With the advent of microservices architecture, application logging has become crucial as it is technically impossible to trace the requests flowing through several applications. There are many Log aggregation solutions available in the market. This blog will focus on a relatively new log aggregation solution called Grafana Loki.
Managing large volumes of log data
Log aggregation solutions are instrumental in managing the volume and complexity of logs generated by enterprise software applications. As applications scale and become distributed across various servers and environments, the sheer volume of log data can become overwhelming. Log aggregator plays a critical role in aggregating logs from disparate sources and extracting meaningful information to offer a unified view of application activities.
Furthermore, log aggregation solutions enhance troubleshooting and debugging processes by providing a comprehensive and coherent timeline of events. Instead of searching through disparate logs to identify patterns, anomalies or potential issues. They are essential for maintaining visibility, traceability and overall operational efficiency in the enterprise application landscape.
Grafana Loki – Overview
Loki is a horizontally scalable, highly available, multi-tenant log aggregation system inspired by Prometheus. Designed to be extremely cost-effective, Loki is easy to operate as it accepts logs in any format from multiple sources and a wide variety of clients. It does not index the contents of the logs, but rather a set of labels for each log stream.
Why Grafana Loki?

Ease of Setup: Get started easily because you can send logs in any format, from any source, using a wide array of clients.

Object Storage: 100% persistence to object storage ensures that you get petabyte scale, high throughput, cost-effective and durable storage.

Metrics and Alerts: Build metrics and generate alerts from your log lines.

Ease in Data Ingestion: No ingestion log formatting requirements giving you more flexibility and the option to format at query time.

Real-time Log Monitoring: Tail your logs in real-time to see them as they come into the system, update the logs periodically, and view logs for specific dates.

Native Integration: Natively integrates with Prometheus, Grafana and K8s so you can seamlessly move between metrics, logs and traces within a single UI.

Minimal Indexing: Unique approach of indexing the metadata rather than the full text of the log lines. Due to this minimal indexing approach, Loki takes far less storage as compared to other solutions.
Grafana Loki Solution Architecture
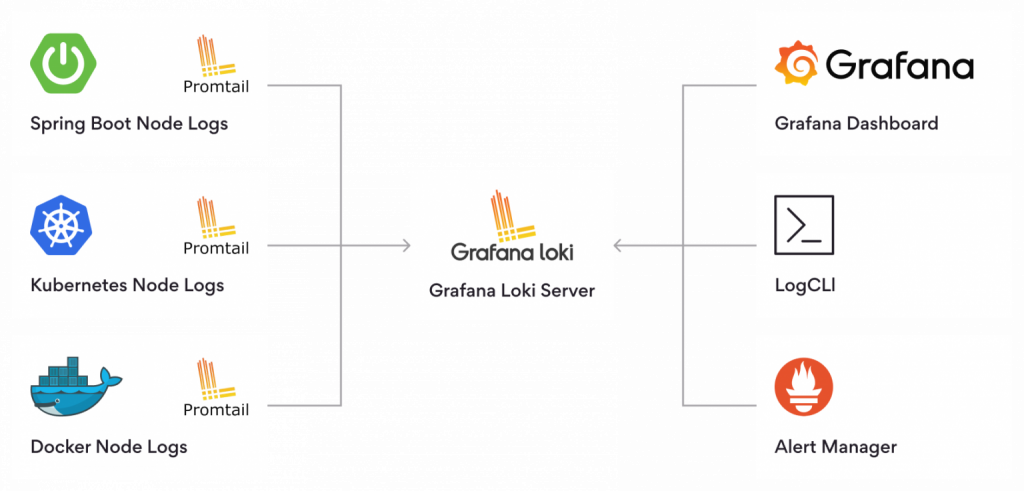
Main components of Loki
Gafana Loki stands out as a powerful logging and monitoring solution, offering unparalleled efficiency and flexibility.
Promtail Agent:
Promtail is a log collector built specifically for Loki. It uses the same service discovery as Prometheus and includes analogous features for labeling, transforming, and filtering logs before ingestion into Loki. This is a simple agent that needs to be running on each node where we indent to capture logs from.
Grafana Loki Server:
Loki does not index the text of logs. Instead, entries are grouped into streams and indexed with labels. Not only does this reduce costs, but it also means log lines are available to query within milliseconds of being received by Loki.
Grafana Dashboard:
Quickly use the Grafana dashboard to show the visualizations and the logs sent to the Loki Server.
LogQL:
Use Loki’s powerful query language, LogQL, to explore your logs. Run LogQL queries directly within Grafana to visualize your logs alongside other data sources, or with LogCLI, for those who prefer a command line experience.
Alert Manager:
This involves setting up alerting rules for Loki to evaluate your incoming log data. You can configure Loki to send the resulting alerts to a Prometheus Alert Manager so they can then get routed to the right team.
As businesses navigate the complexities of managing vast amounts of data, they require a reliable partner to help them address their logging and monitoring management needs. With our team of 1000+ integration experts with experience of executing 120+ integration strategy projects for clients across industries, Persistent Enterprise Integration practice provides tailored solutions that empower clients to gain actionable insights, enhance system performance and ensure seamless operations.
Navigate through your enterprise integration journey with ease. Talk to us today !
Author’s Profile

Ajit Mahajan
Head of Solutions for Integration